
Deep Dive into your Analytics
.jpg)
Being able to quickly analyse your business data is essential for brokers looking to succeed. Keeping a finger on the pulse of your daily operations can help you identify where opportunities and challenges exist in your business.
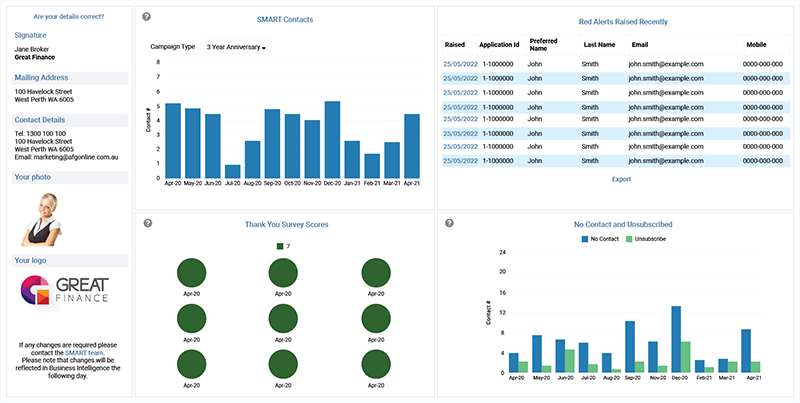
With Analytics, you can run reports for oversight on key metrics and assess how your business is performing. Analytics is AFG's interactive reporting tool where you can access data on your deals lodged and settled, commission payments, portfolio growth, customer statistics and SMART campaign information. Data is presented as a series of graphs, tables and charts through a series of dashboards.
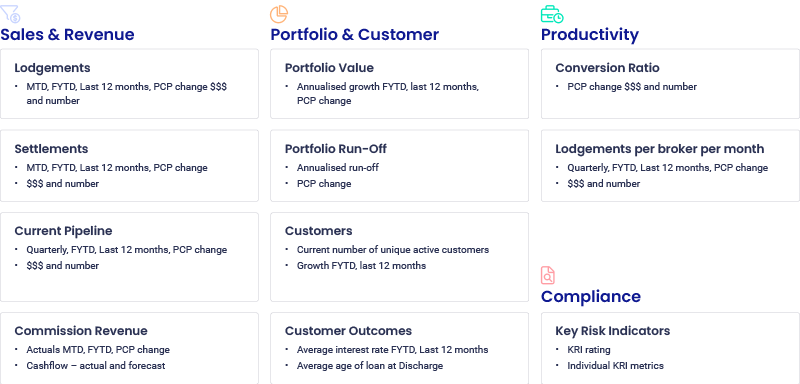
Key metrics to consider
What metrics should I look at?
To measure your business performance, you should have benchmarks in place and check in regularly to see how you are measuring against these benchmarks.
Spotlight: Understanding Portfolio Run-off
Portfolio run-off is one of the key performance indicators of the health of your business and more specifically, your trail. By keeping an eye on portfolio run-off, you can understand how well you’re looking after your existing customers as well as securing new business. If run-off is too high, it may mean that you need to win more work to maintain the same amount of earnings in trail.
What is it?
The value of loan balances paid plus the value of loans that fully discharged during the period.
Inputs needed:
- Monthly opening values for 12 month period
- Settlements during the same 12 months
- Closing value at end of 12 months
- Run-off ($) [Opening Value] + [Settlements] – [Closing Value]
- Run-off (%) [Run-off ($)] / mean[Monthly opening values]
Note: If calculating over less than 12 months, then need to annualise the Run-off % by multiplying by 365/(number of days covered in run-off $ calc).
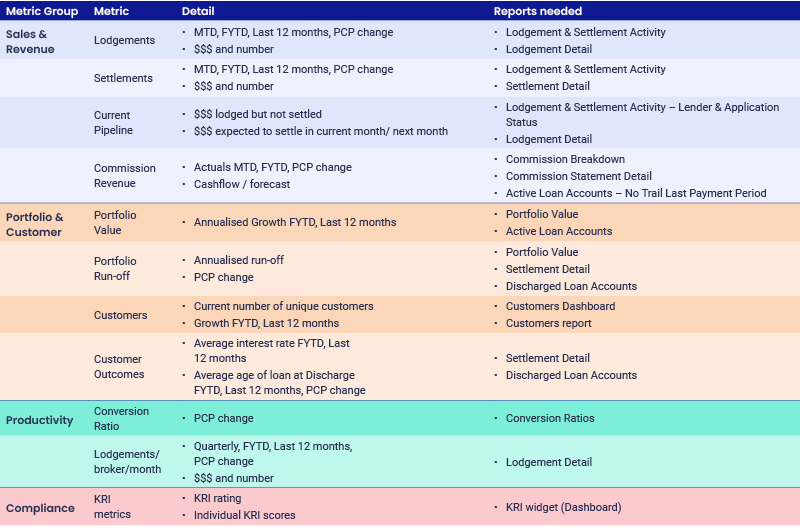
Where do I get the information from in Analytics?
To see where you get the information from and which reports may be useful in Analytics, we have prepared this handy cheatsheet.
Alex Maund, Head of Analytics recently hosted a Back to Basics session to run through the cheatsheet and provide a live demonstration of Analytics with helpful tips. If you missed the session, we would recommend watching it here, for which you will receive 1 CPD point.
Getting started with Analytics
The Analytics platform with full functionality is accessible to SMART members.
If you are already a SMART member and want a detailed overview of how to use Analytics you can watch Getting started with Analytics. Reminder: If you're a SMART member, you can use the SMART stats screen in Analytics to review your current branding.
If you are not a SMART member, we currently have 50% off the sign up fee so please do reach out to your Partnership Manager to discuss how SMART and Analytics can help your business soar!
Recommended Articles
.jpg)

Stay up to date with the latest updates
View all of the latest articles to help enable you to grow and succeed as a mortgage broker with AFG.
View all